💻 Custom Visualizations in R with ggplot
In April 2020 Tyler Heaps (former Director of Sporting Analytics at U.S. Soccer) shared some of the visualizations from automated post-match reports Kevin Shank, Rishi Kowalski (YNT Performance Analysts) and I had built prior to that time using R’s ggplot library.
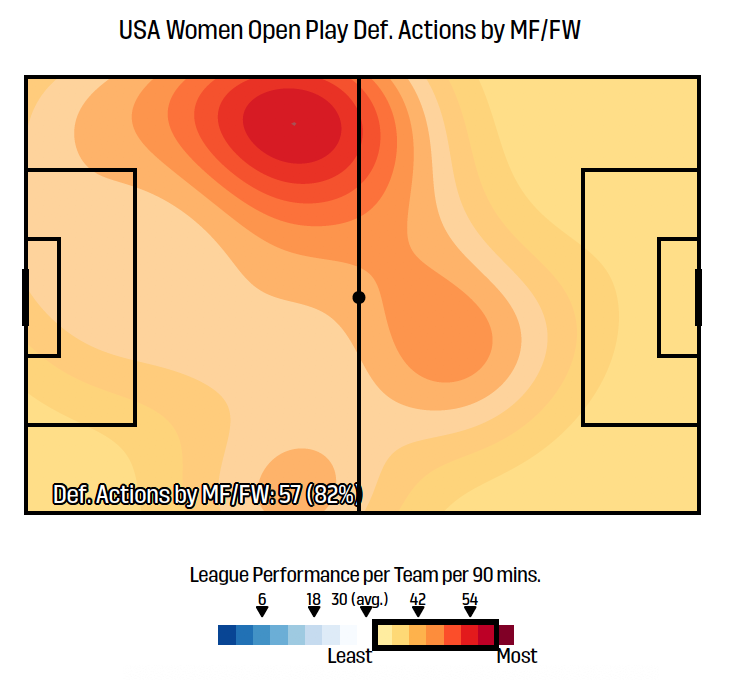
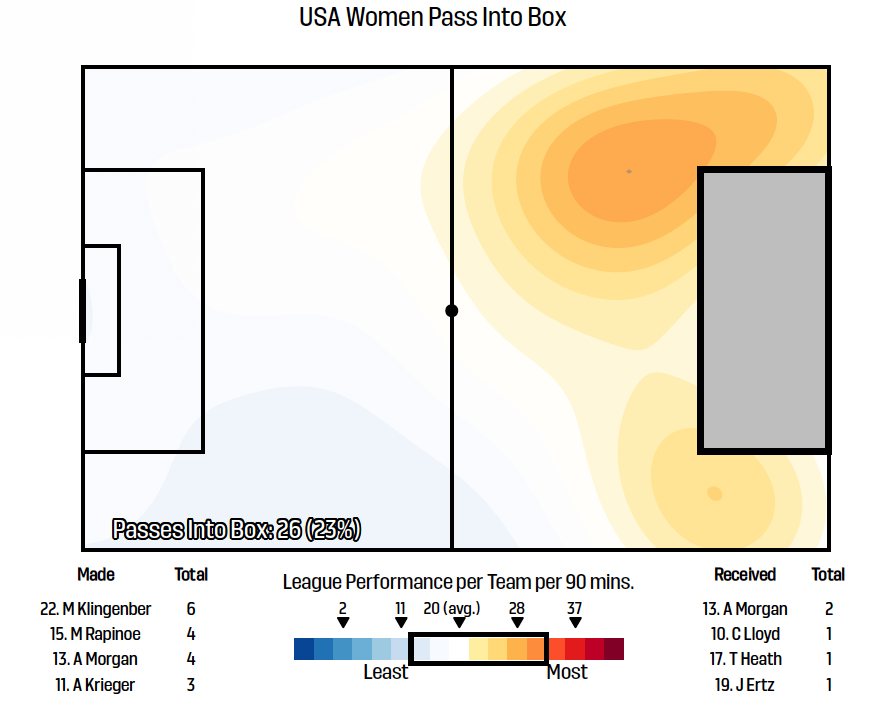
Below are two examples of one of my favorite custom visualizations I contributed to this project. Within these visualizations we use heatmaps both to show the relative frequency and execution location of certain actions - in this case open play defensive actions by midfielders and attackers, and passes into the box, but it can be used to visualize any type of action - within a single game as well as the relative frequency of these actions compared to leagues average performance from the past year. The former is done by fitting a 2-dimensional Gaussian distribution to the x,y coordinates of the actions. The latter is done by choosing a 7 shade color palette for the plot from a total of 17 shades by comparing the total in-game action count to the total league-wide game-by-game action count distribution.
See the twitter thread below for more visualizations from these post-match reports.
Luckily we have loads of historical data to analyze in these times with no live games... big shout to @unravelsports @Kev_Shank @Rishi_Kowalski who have done great work in building out our internal reporting for pre/post match. First 30 minutes in the book from July 2015. pic.twitter.com/At9NjTbzTi
— Tyler Heaps (@tjheaps) April 6, 2020