🔬 MIT Sloan Sports Analytics Conference Research Paper Competition 2017
Somewhere at the end of 2015 or start of 2016 I finally learned how to code using Python, by building a webscraper (using BeautifulSoup4). This webscraper allowed me to scrape 4 seasons (2012–15/16) of Opta event data from Squawka spanning 6 big European leagues with 8219 matches, 3532 unique players and 155 unique teams.
In that same period I was in my first semester of the Operations Management & Logistics Master at the Eindhoven University of Technology. Were, during basically every different course, from Spare Parts Management to Linear Optimization and Game Theory I was theorizing about how to apply all their unique methodologies to the beautiful game of football.
Eventually this lead to me writing a research paper on Network Motifs in football passing networks called: Flow motifs in soccer: What can passing behavior tell us? under the supervision of Dr. Shaunak Dabadgao, Assistant Professor at the Faculty of Industrial Engineering and Innovation Sciences.
The research was accepted into the MIT Sports Analytics Conference in 2017 and published in the Journal of Quantitative Sports in 2019.
In the article we show how to support decision making within clubs by analyzing the unique passing behaviors (motifs) of players and teams from the patterns, or building blocks, of their passing behavior.
We differentiate between two types:
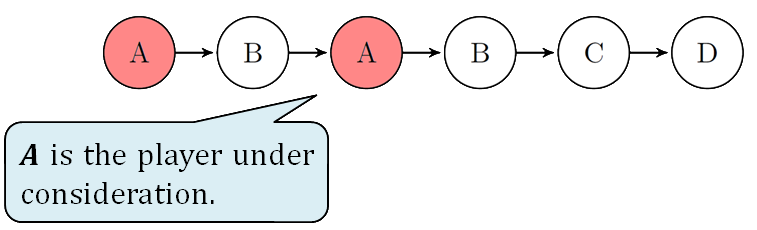
Possession Motifs (PMs): a sequence of at least 3 passes a team/player creates that does not lead to a goal attempt. In Figure 1 we see ABAB, BABC and ABCD respectively.
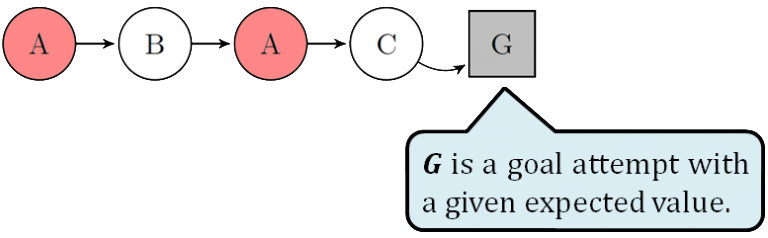
Expected Goal Motifs (xGMs): a sequence of at least one pass that leads to a goal scoring opportunity with a certain expectation of being converted. We introduce this Expected Goals variant to measure the effectiveness of styles of play, and to capture the level of goal-orientation each player/team has hidden in their passing motifs. In Figure 2 we see expected goal motif ABACG.
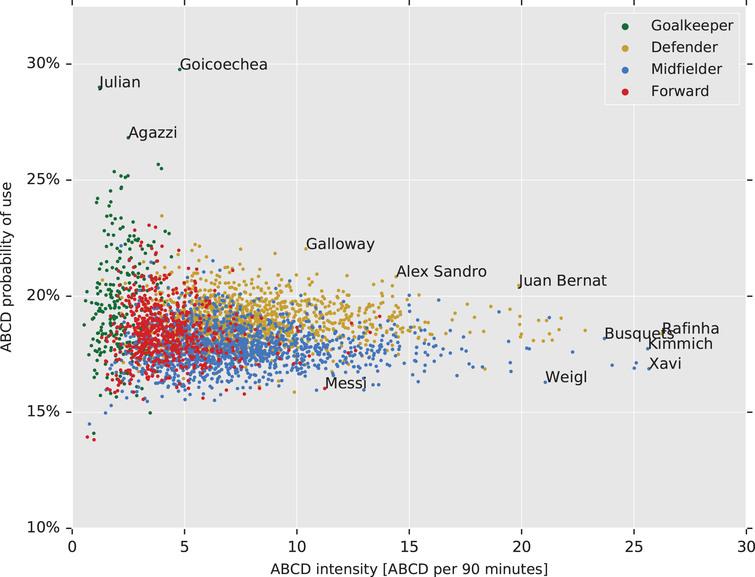
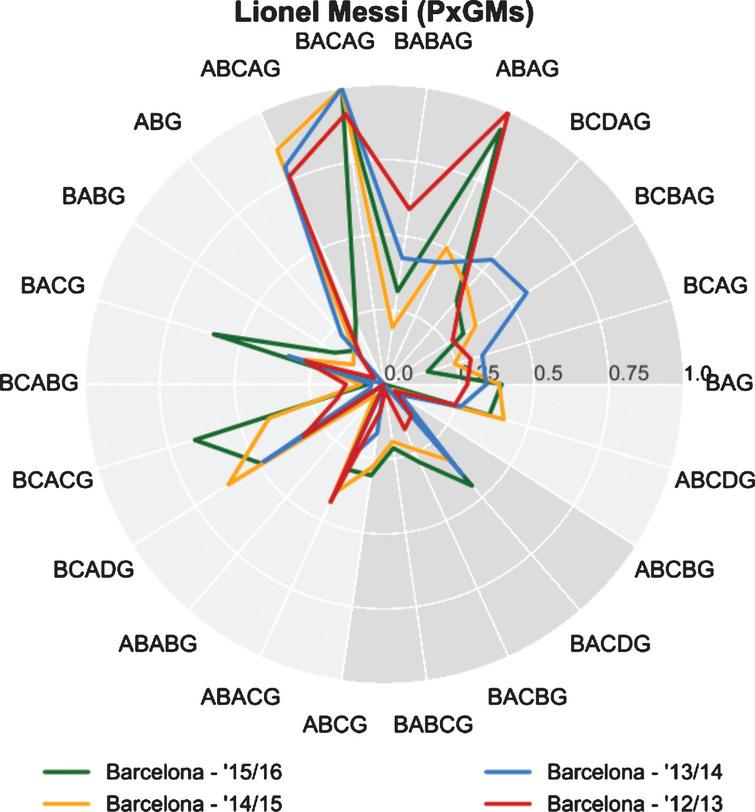
We analyze individual players as well as teams based on the diversity and frequency of their involvement in different motifs. We also make use of a novel way to represent the motif data (the radar graph) to make comparisons between players and teams across multiple seasons. We show how this analysis can support scouting for players and managers, identifying unique players/teams, finding relationships between position and style and in finding a suitable replacement for FC Barcelona’s Xavi.