🔬 Expected Pass Model
During the break of the friendly international match between The Netherlands and Belgium on November 9th 2016 Jordi Clasie was subject to several unfriendly tweets asking Dutch head coach Blind to substitute him. The reason? His pass success rate was just 66% in the first half.
While at a first glance this seems like a reasonable proposal, I don’t think subbing someone just for his pass accuracy is the right approach. What if Jordi Clasie had a pass success rate of 95% in the first half, instead of 66%, but passed all his passes back to the goalkeeper? This is clearly a higher success rate, but does not line up with his strategic requirements of assisting Bas Dost or Vincent Janssen. And what if Jordi Clasie attempted to find either striker with every single pass he played? If that was the case, 66% pass success must be great, resulting in a lot of potential scoring opportunities for the Netherlands.
To see if we can counter the ambiguity inherently present in the regular pass success rate metric we set out to find a better way to go about judging players’ passing performance.
7,000,000 Pass Baseline
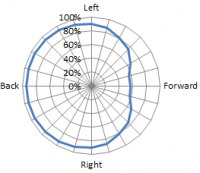
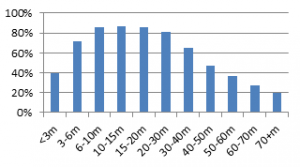
To do this we first analyzed 7,000,000 passes played during 23 seasons in the Eredivisie, Premier League, Serie A, La Liga, Ligue 1 and the Bundesliga between 2012 and 2016 (unfortunately we do not have the specific match data for the international match between The Netherlands and Belgium). From this we can clearly see (Figure 1) that it is inherently harder to pass a ball forward than it is to pass a ball backwards (on an arbitrary location on the pitch) ánd in Figure 2 we can see that (very) long passes (above 30 meters) and very short passes (below 3 meters) are more than twice as unsuccessful as medium length passes. Furthermore we found that it is also inherently more difficult to make passes on specific areas of the pitch (e.g. the closer the pass is made to the opponents’ goal, the lower the success rate). This implies that if Clasie passed all his balls forward, or perhaps longer than 30 meters, 66% might not even be such a bad number.


Now that we’ve got this out the way, we can create a model wherein every pass made by a player during a match is compared to passes with similar characteristics (direction, length, location). This gives us an expected pass value for each type of pass - the average of all similar passes made within the 7,000,000 pass data set. Now we compared each pass made in the current season of the English Premier League to between 28,000 and 50 historical passes that are similar to the pass in question. This expected pass value is compared to the success of the actual pass (either 0 [failed] or 1 [success]) to see whether or not a player passed better or worse than could be expected from him during a game (or season) given the exact type of passes he made.

Interactive Analysis Tool
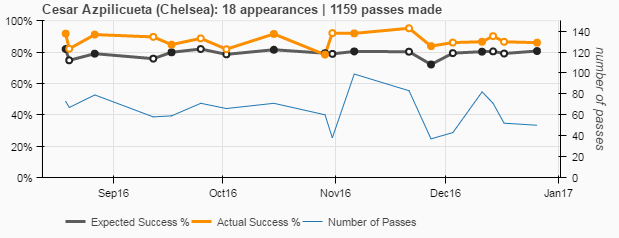
Over a given season a players’ specific pass performance might look something like Figure 3. Here we see Cesar Azpilicueta’s pass performance for the first 18 matches of the ’16/17 Premier League season. We can easily see that Azpilicueta is a very prolific passer, performing above expectation for 17 out of 18 matches (everywhere the orange line lies above the black line). The only match Azpilicueta passed below expectation (by 1%) was in a home match against Manchester United.
From this graph we can furthermore gather that Azpilicueta is a very consistent risk taker, with an expected pass success of close to 80% across all but one match (72% against Tottenham Hotspur).

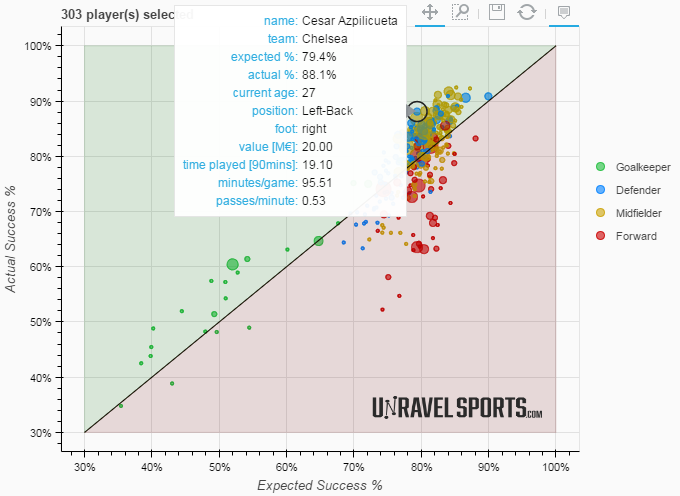
Now that we know the pass performance for every player in every match during the season we can take the weighted average of both the expected and actual pass success rates and plot them on a scatter plot. Figure 4 shows 303 players in the English Premier League. Every circle indicates the average actual/expected success percentage over the whole season for one player. The nodes in the green part of the graph perform better than expected and all the squares in the red part of the graph perform worse than expected.
The further a player is away from the central divide (the black line) the better/worse the player performs.
The risk a player takes with his passes can be read from the expected pass success percentage. The closer the expected success percentage of a players passing is to zero, the more risk he takes, because we expect less of his passes to arrive.
