🔬 An Intuitive Measure for Pressing
For a long time I’ve had the aim to develop an intuitive measure for pressing that can be used by coaches, assistants and (data) analysts to identify and analyze pressing situations, compute advanced derived metrics (e.g. moving out from under pressure after receival), and analyze specific in-game situations related to pressing. This approach should utilize positional tracking data to determine the amount of pressure from every defensive player to every attacking player at the individual frame level. It should not be too simple (e.g. counting players near the player in possession), it should not require any (“black box”) prediction models or an un-godly amount of manual annotation, it should be relatively easy to explain, and it should be logically summable (e.g. not n players in a radius around another player equals n pressure).
Below is a non-exhaustive list of different approaches that could be used to measure pressing, but did not meet all of the above criteria.
- PPDA (StatsBomb, 2014)
- Pressure Zone (Andrienko 2016)
- VPEP (Robberechts, 2019)
- Space Occupation Gain (SOG) (Fernandez & Bornn, 2018)
Pressing Intensity
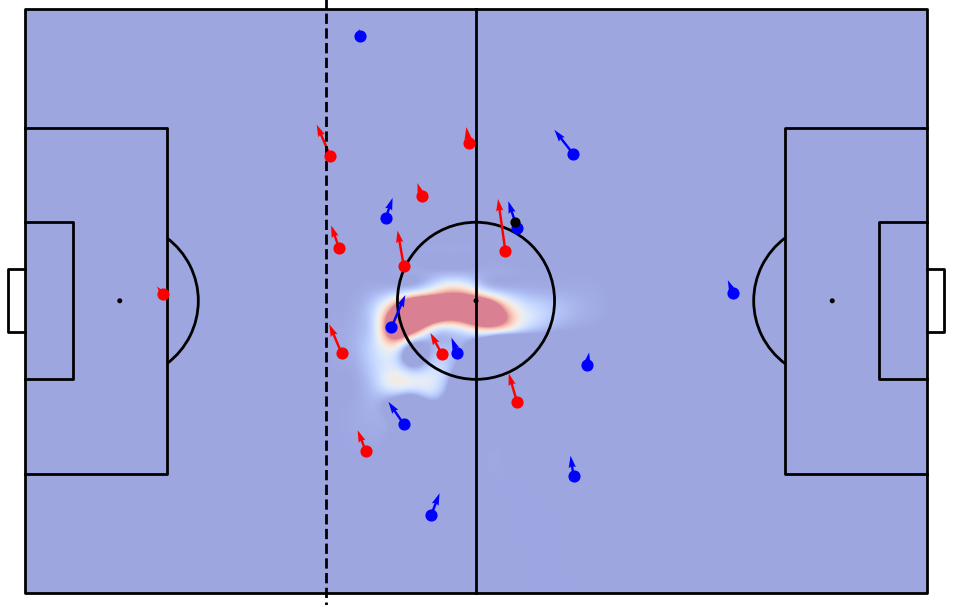
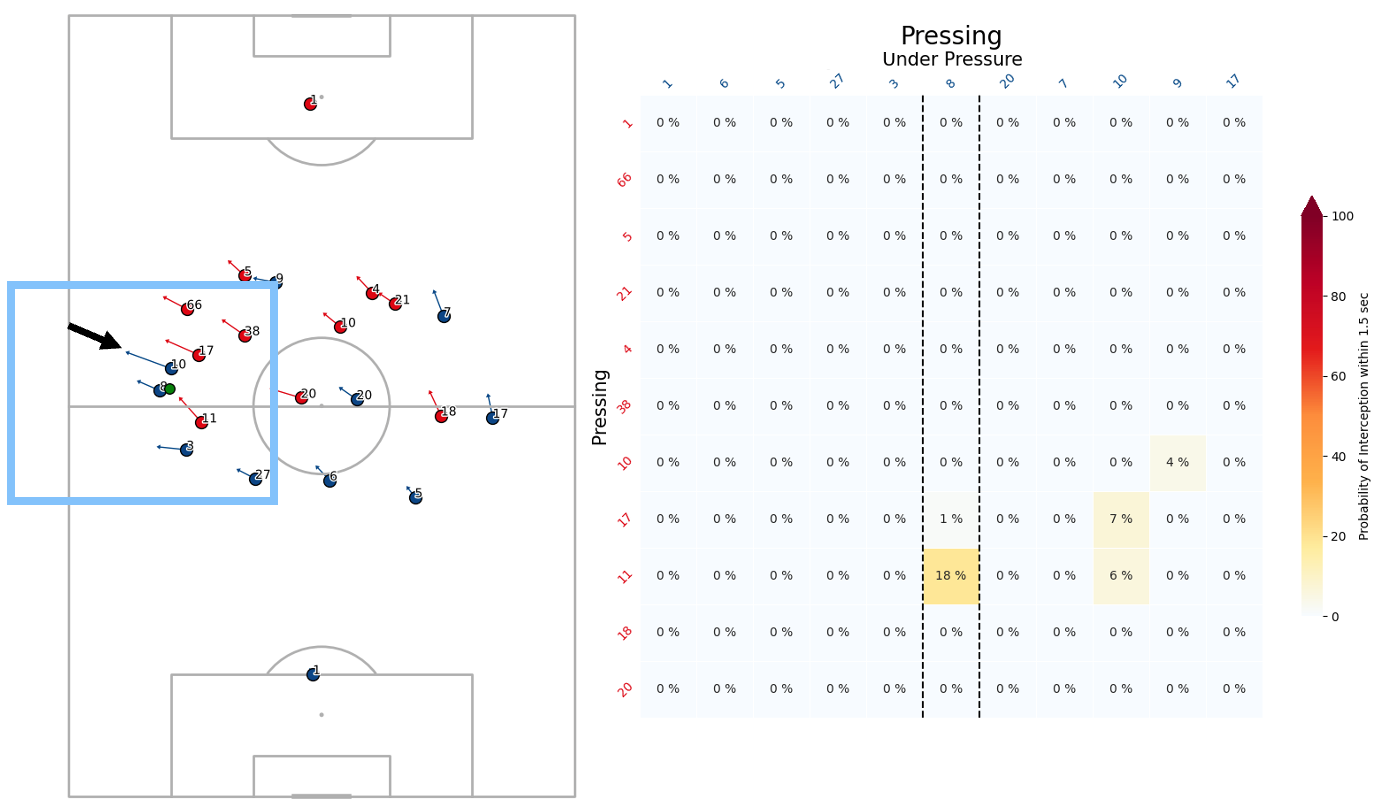
Below is an animation of what this pressing metric, simply coined Pressing Intensity, looks like during a build-up phase. Each column lists a player on the team in possession, the column surrounded by dashed lines indicates the player in possession of the ball and each row represents a player in the team applying pressure.
Time to Intercept the Opponent
Pressing Intensity uses an important aspect of Spearman’s Pitch Control model, namely the Time to Intercept calculation. This estimates the time it will take a player to get to any location on the pitch, given an initial starting velocity and a certain reaction time parameter.
An open-source implementation of this Time to Intercept can be found in Devin Pleuler’s Soccer Analytics Handbook.
Instead of computing the time it takes a player to reach a specific location on the pitch, we compute the time it takes for a player to reach the location another player is moving towards, given both of their velocities and a reaction time parameter for the pressing player(s).
A vectorized implementation of this Pressing Intensity Time to Intercept calculation in Python is shown below.
import numpy as np

def tti_pressing_intensity(p1, p2, v1, v2, reaction_time, max_velocity):
    """
    BSD 3-Clause License

    Copyright (c) 2025 [UnravelSports]

    See: https://opensource.org/licenses/BSD-3-Clause

    This project includes code and contributions from:
        - Joris Bekkers (UnravelSports)

    Permission is hereby granted to redistribute this software under the BSD 3-Clause License, with proper attribution
    ----------

    Calculate the Time-to-Intercept (TTI) pressing intensity for a group of players.

    This function estimates the time required for Player 1 to press Player 2 based on their
    positions, velocities, reaction times, and maximum running speed. It calculates an
    interception time matrix for all possible pairings of players.

    Parameters
    ----------
    p1 : ndarray
        An array of shape (n, 2) representing the positions of Pressing Players.
        Each row corresponds to a player's position as (x, y) coordinates.

    p2 : ndarray
        An array of shape (m, 2) representing the positions of Players on the In Possession Team (potentially including the ball location)
        Each row corresponds to a player's position as (x, y) coordinates.

    v1 : ndarray
        An array of shape (n, 2) representing the velocities corresponding to v1. Each row corresponds
        to a player's velocity as (vx, vy).

    v2 : ndarray
        An array of shape (m, 2) representing the velocities corresponding to p2. Each row corresponds
        to a player's velocity as (vx, vy).

    reaction_time : float
        The reaction time of p1'ss (in seconds) before they start moving towards p2's.

    max_velocity : float
        The maximum running velocity of Player 1 (in meters per second).

    Returns
    -------
    t : ndarray
        A 2D array of shape (m, n) where t[i, j] represents the time required for Player 1[j]
        to press Player 2[i].
    """
    u = (p1 + v1) - p1  # Adjusted velocity of Pressing Players
    d2 = (p2 + v2)      # Destination of Players Under Pressure

    v = d2[:, None, :] - p1[None, :, :]  # Relative motion vector between Pressing Players and Players Under Pressure

    u_mag = np.linalg.norm(u, axis=-1)  # Magnitude of Pressing Players velocity
    v_mag = np.linalg.norm(v, axis=-1)  # Magnitude of relative motion vector

    dot_product = np.sum(u * v, axis=-1)
    angle = np.arccos(dot_product / (u_mag * v_mag))

    r_reaction = p1 + v1 * reaction_time  # Adjusted position of Pressing Players after reaction time
    d = d2[:, None, :] - r_reaction[None, :, :]  # Distance vector after reaction time

    t = (u_mag * angle / np.pi +  # Time contribution from angular adjustment
         reaction_time +          # Add reaction time
         np.linalg.norm(d, axis=-1) / max_velocity)  # Time contribution from running

    return t
Bekkers, Joris. (2024). "Pressing Intensity: An Intuitive Measure for Pressing in Soccer." ArXiv PDF
Probability to Intercept the Opponent
Now that we have the Time to Intercept from each defending player to each attacking player (and the ball) we convert this into probabilities by passing it through a Sigmoid function. This now gives us the chance a defending player will reach an attacking player or the ball within some amount of time given their current direction and speed.
Total Pressure on a Player
This final step enables us to consolidate the probabilities into a single value for each player, allowing us to determine the total pressure exerted on each attacking player. The total Pressing Intensity on player \(j\) is calculated as:
\(1 - \prod_{i=1}^{11} \left( 1 - p_{i,j} \right)\)
where \(p_{i,j}\) is the probability that player \(i\) will intercept player \(j\) within \(t=1.5s\). (We are very naively assuming all these probabilities are independent.)
Model Improvements
We need to make some improvements to be able to practically use this model. One of the main issues with this implementation is that there is no distinguishing factor between an attacking player moving towards a defending player, or (what we are actually looking for) a defending player moving towards an attacking player.
Active Pressing
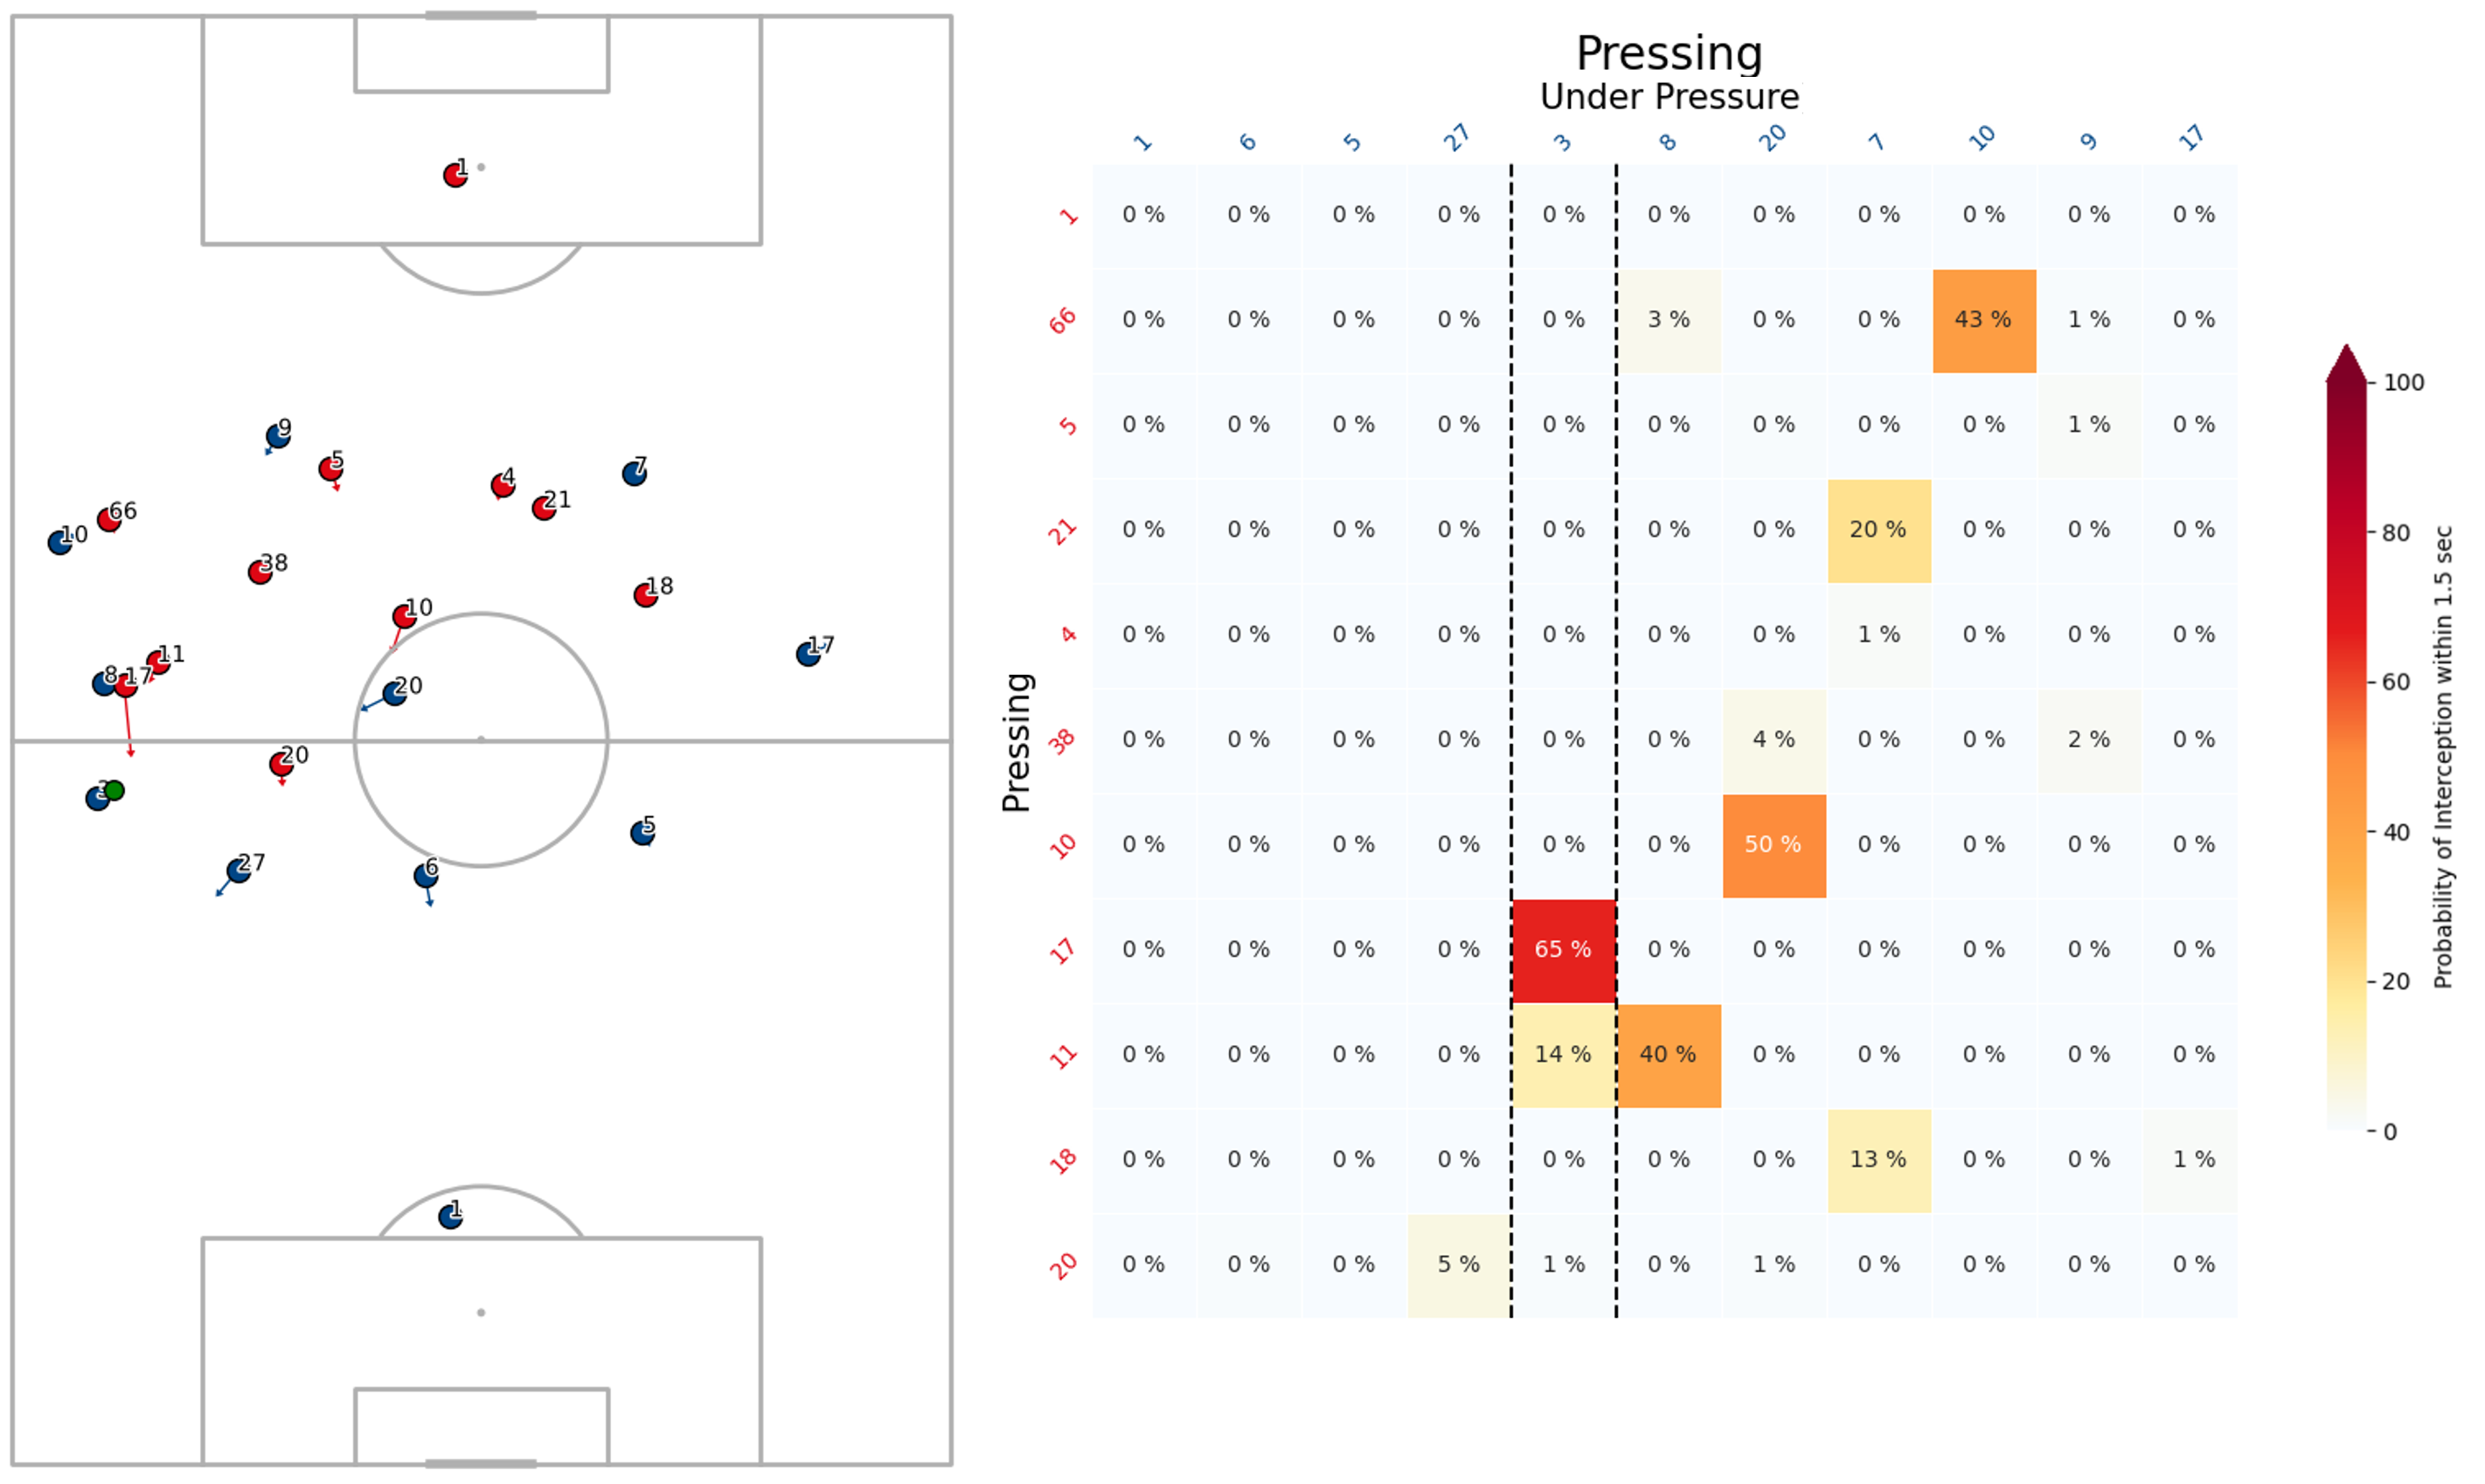
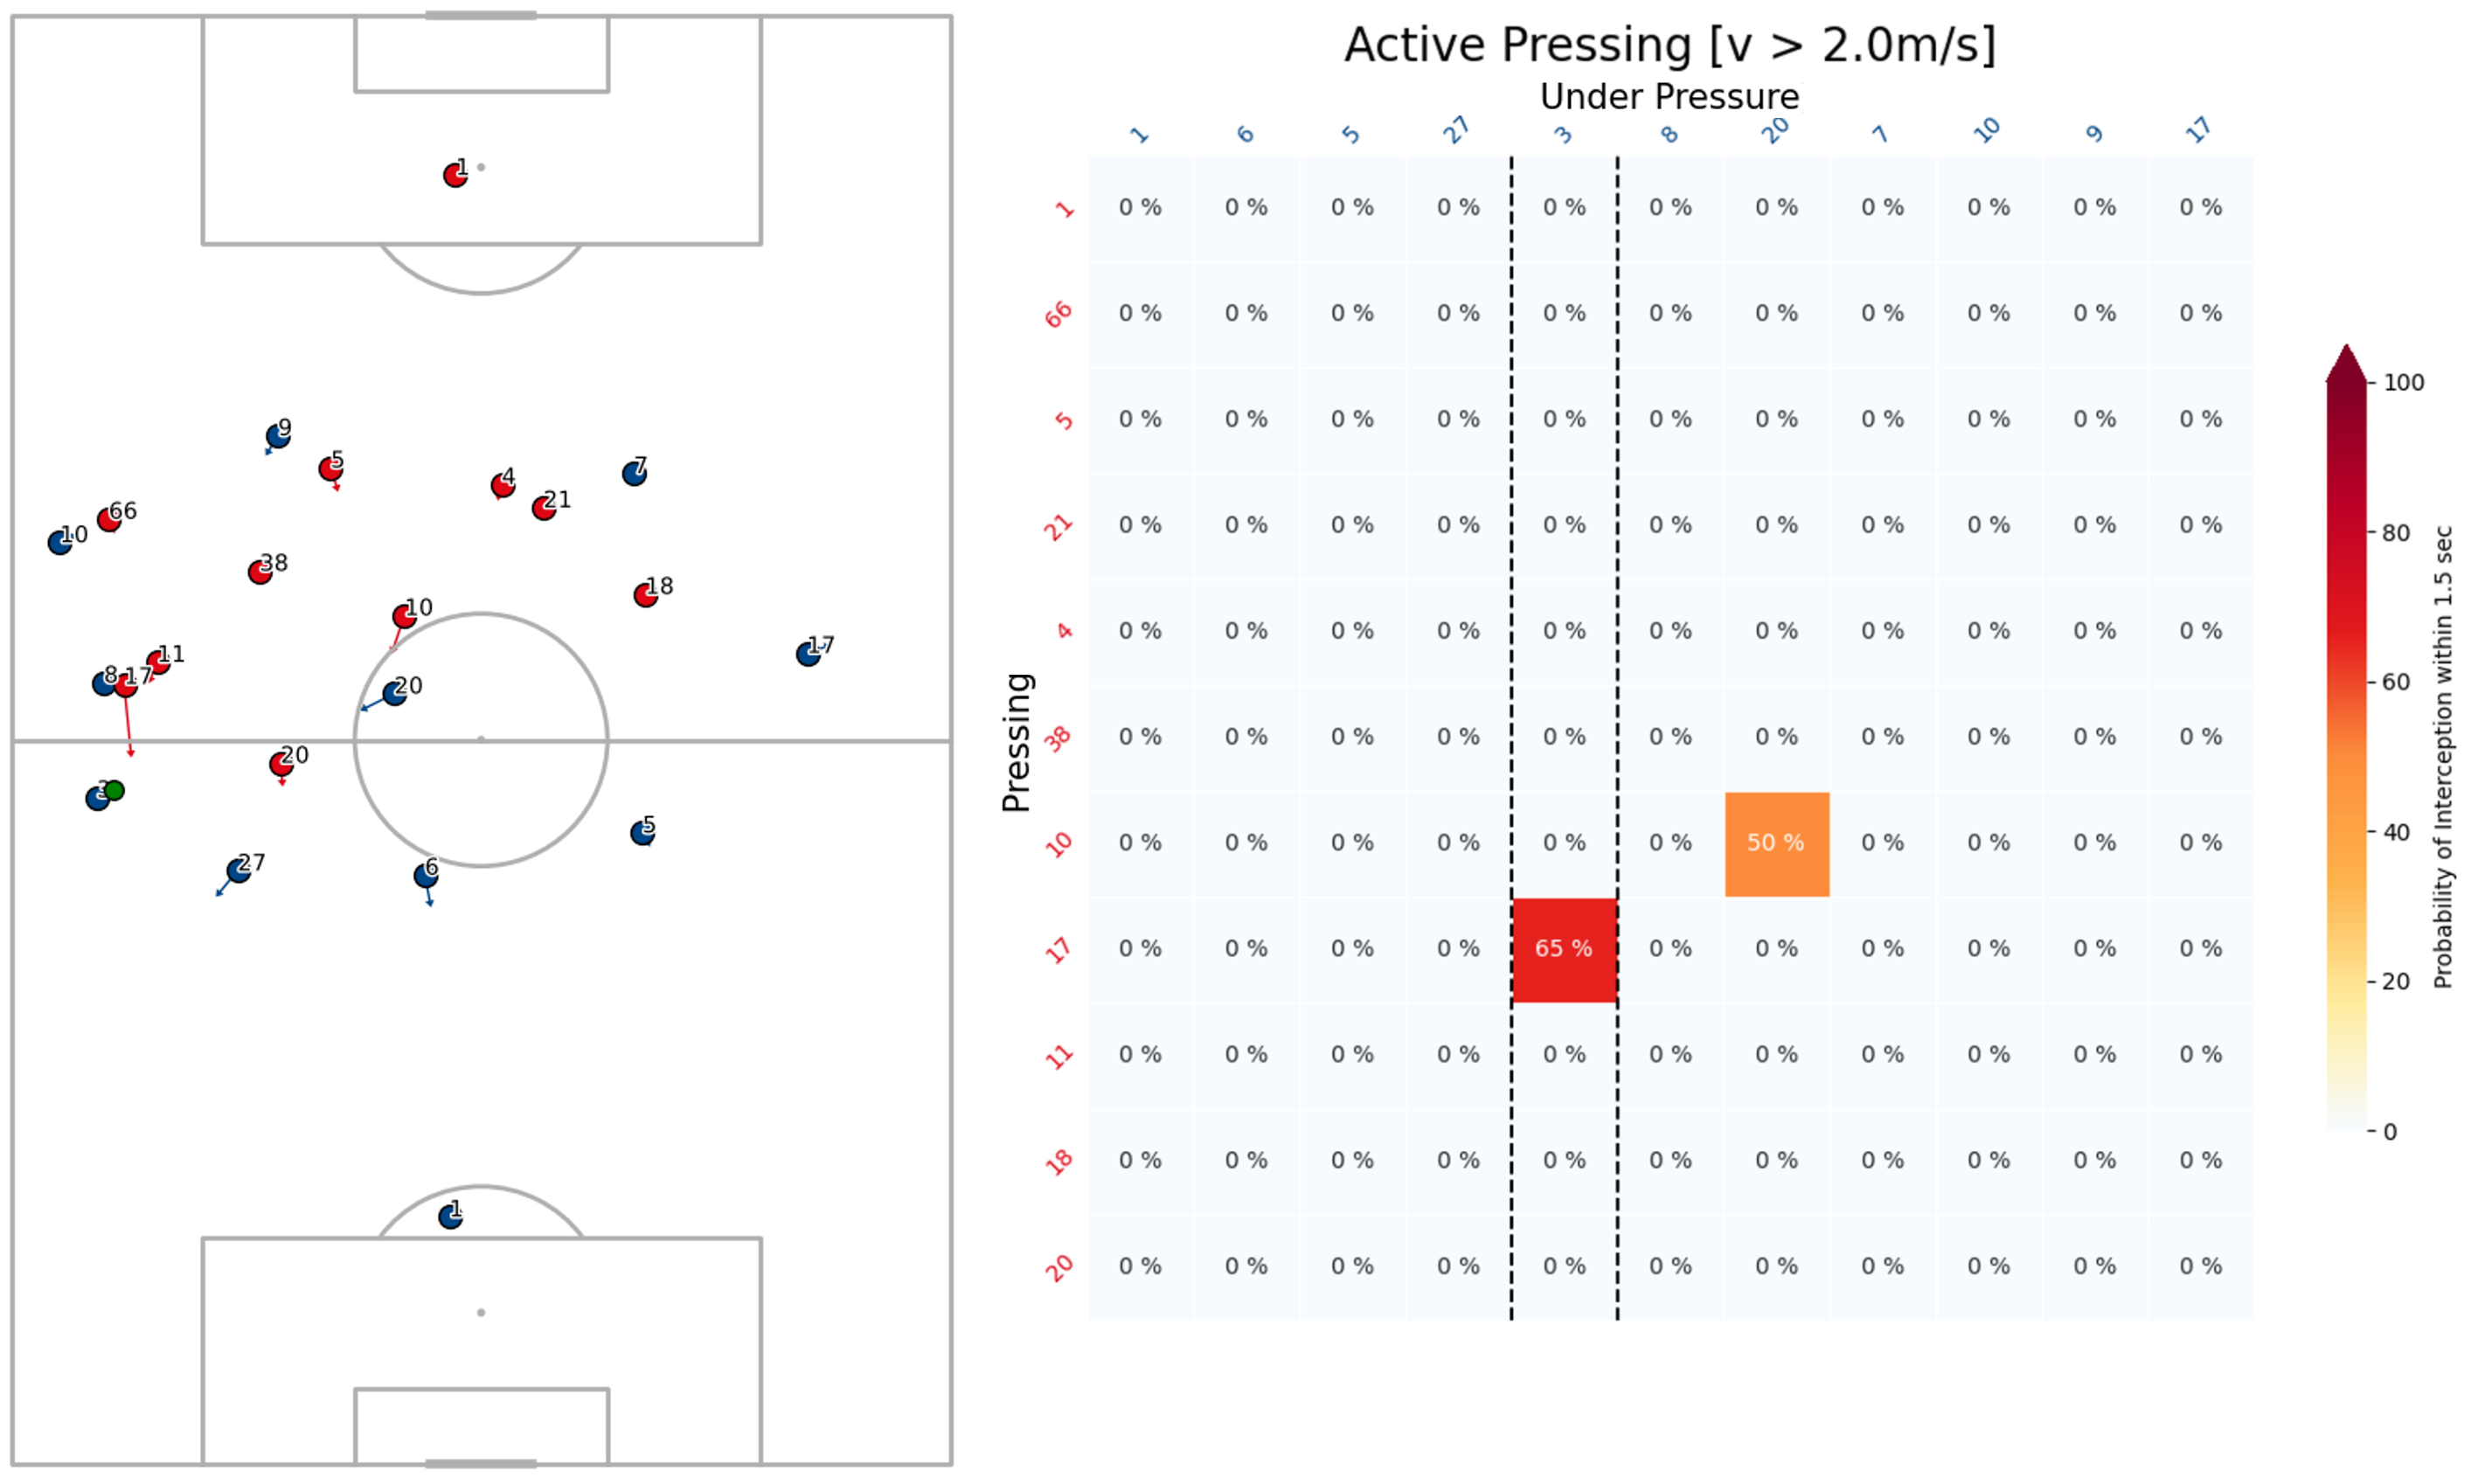
To account for this we introduce an Active Pressing speed threshold such that any chance of intercepting an attacking player (\(p_{i,j}\)) is set to zero when a defending players’ speed is below this threshold. Figure 3 shows the unfiltered pressing intensity for a snapshot of tracking data, and Figure 4 shows the same situation with the noise filtered out through this speed threshold.
Pitch Boundaries
An issue with this approach is shown in Figure 5. The model assumes an infinite playing surface. As a result, when players are pressed toward the sideline — while at a similar speed than the players they are pressing and at such a that they cannot be caught within 1.5 seconds — the situation is treated as pressure-free.
This limitation could be addressed by introducing a Pressing Intensity along the sidelines, acting opposite and equal to the force exerted by the attacking player(s) moving toward it.
Model Extensions
Finally, I’d like to close with some potential extension of this Pressing Intensity model.
Pressing / Closing Down Pass Lanes
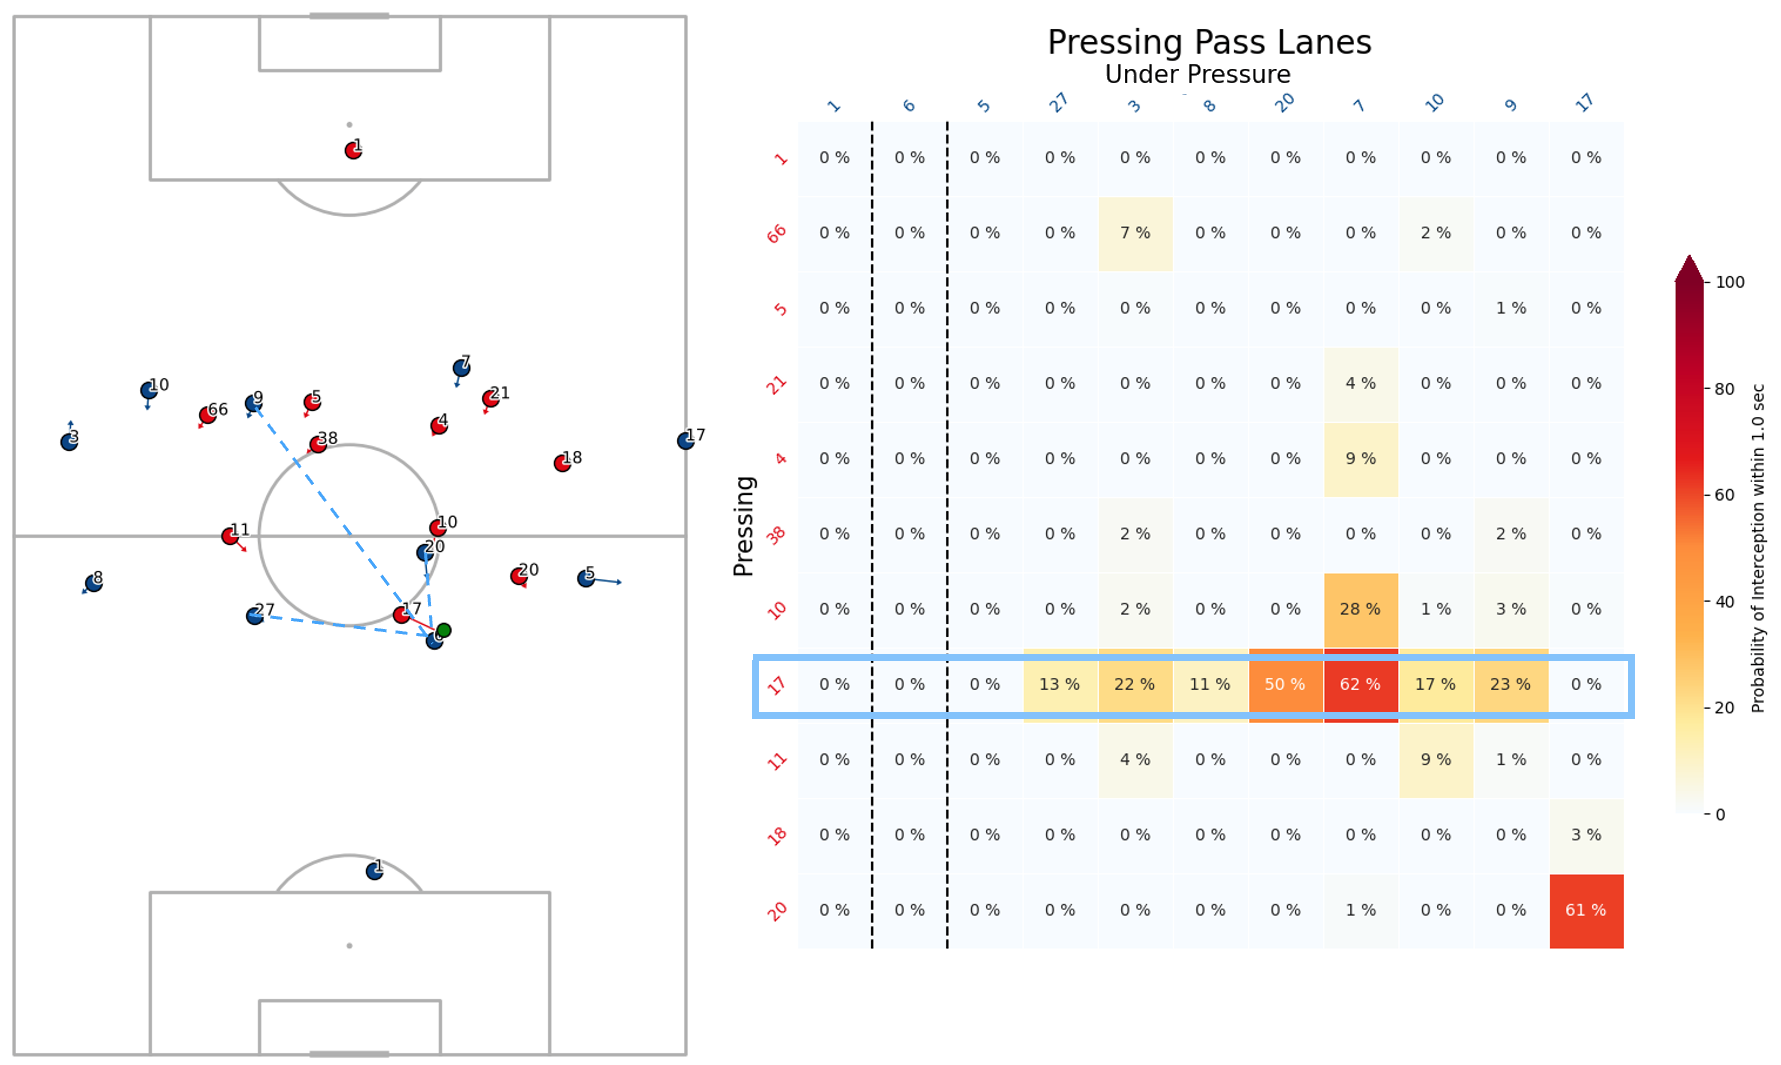
By replacing the locations (+ velocities) of the attacking players by the closest - perpendicular - point (and their respective velocities) of each defensive player towards each pass lane (see Figure 6) we can measure Pressing Intensity in relation to closing down passing options, instead of closing down the attacking players directly.
An example of this is shown in Figure 7. This implementation can be extended further and would require more fixes than simply those mentioned above in relation to the initial Pressing Intensity metric.
It might be good to note that at some point doing these types of calculations will simply converge back to our more complex Pitch Control calculations.

Smart Pressing
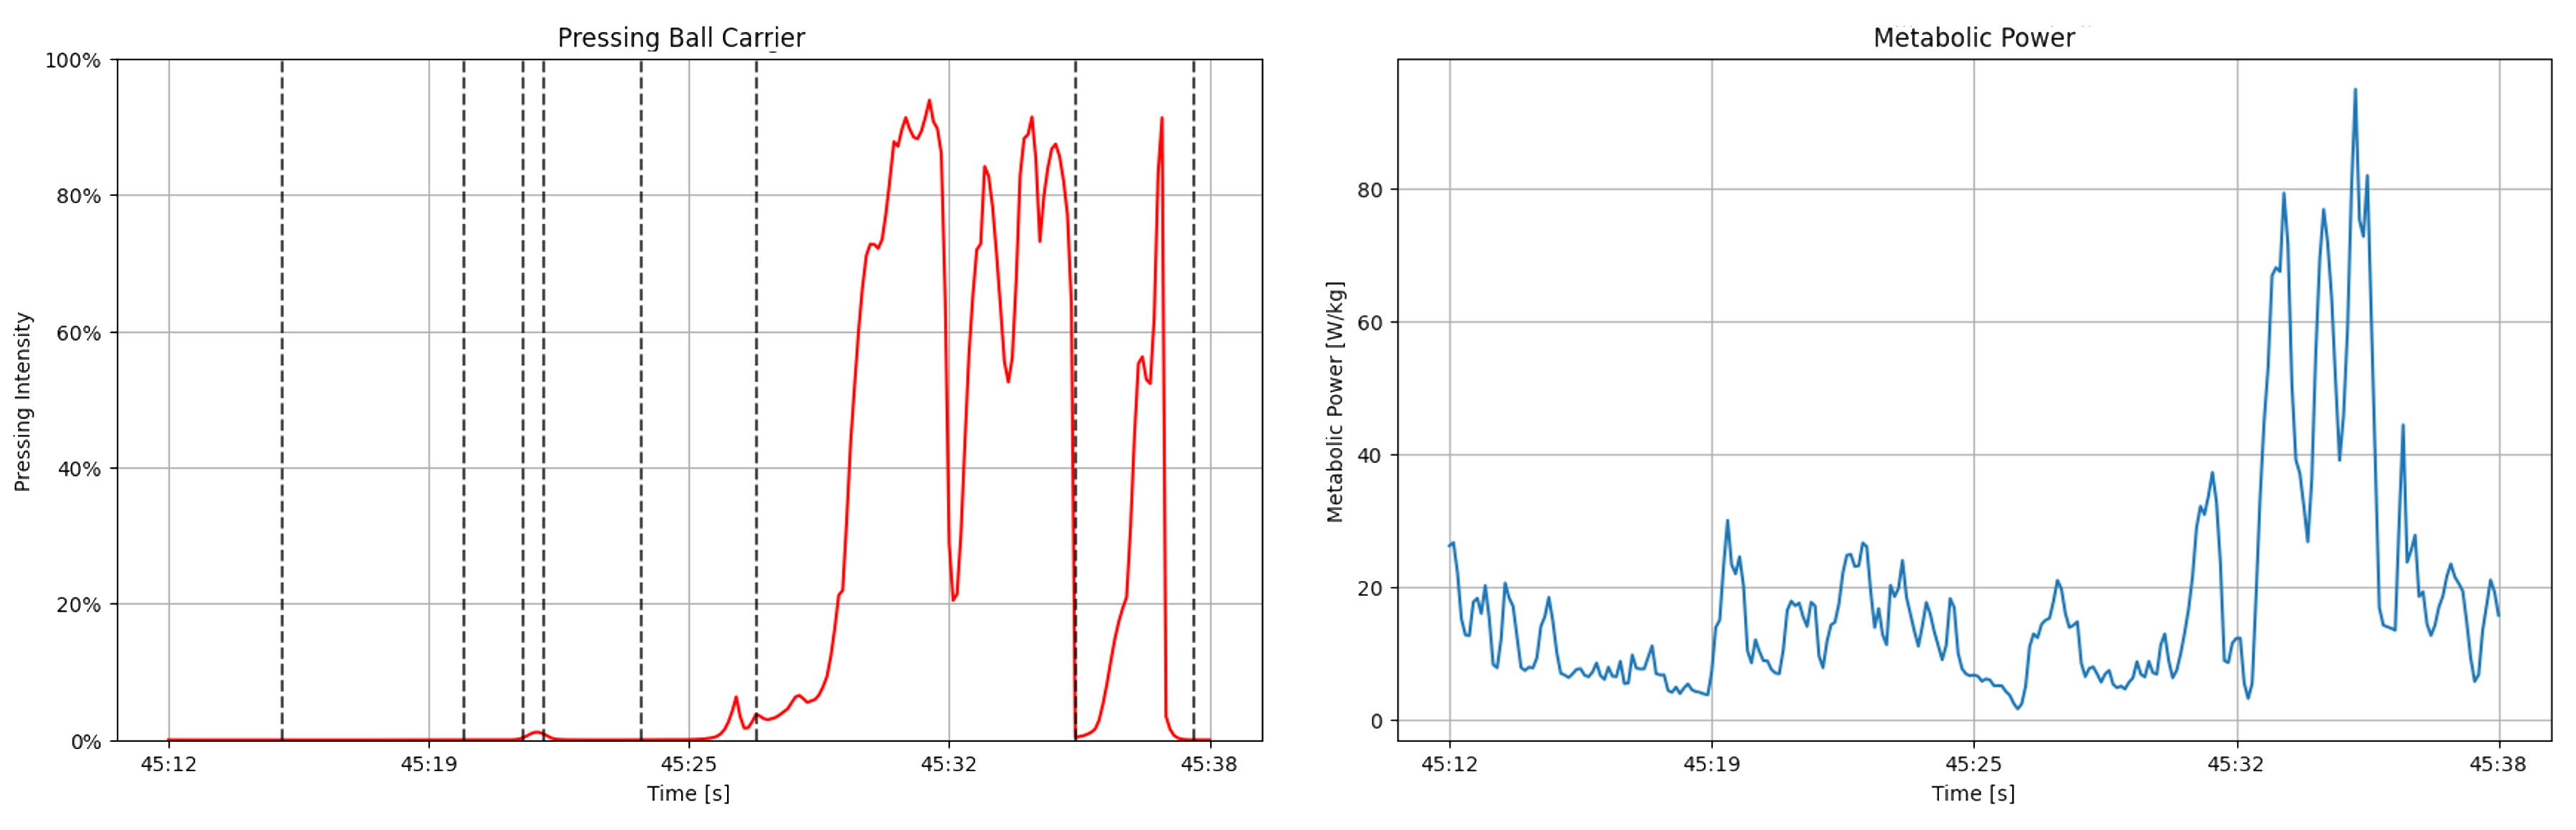
Because Pressing Intensity is measured at the individual tracking frame level we can start thinking about ways to measure smart pressing, or efficient pressing, by considering the amount of energy expensed during an out of possession sequence in the form of Metabolic Power (Floodlight). Figure 8 (on the left) shows a players’ Pressing Intensity on the ball carrier, where dashed lines indicating a change in ball carrier. On the right we show his metabolic power expensed during this same time frame.
I presented parts of this work during a SkillCorner event in Dallas, TX in November 2023